By Sydney Beveridge, Social Explorer

With the new school year approaching, Social Explorer is taking a closer look at education data today and over the years. In this installment, we are looking at some of the earliest reported census data related to education.
The Census Bureau first reported literacy data on reading and writing in 1840. At the time, 91.5 percent of the adult white population (over the age of 20) was literate.
In 1850, the white literate population fell slightly to 89.8 percent. Meanwhile, the illiterate free colored* population (41.3 percent) was over four times as large as the illiterate white population. These literacy rates appear to be closely linked with school attendance rates. That same year, 56.1 percent of white children (aged 5 to 19) attended school while just 17.1 percent of the free colored population (aged 5 to 19) attended.
In both the black and white populations, women were less likely to be literate than men, but the gender gap in literacy rates was wider among whites (59.5 percent of illiterate white adults were female; 55.0 percent of illiterate black adults were male).
However, children were attending school at similar rates (53.3 percent of white female school age children compared to 52.7 percent of white male school age children; and 16 percent of free colored female school age children compared to 18.4 percent of free colored male school age children)—a trend which would contribute to improved literacy rates in the coming decades.
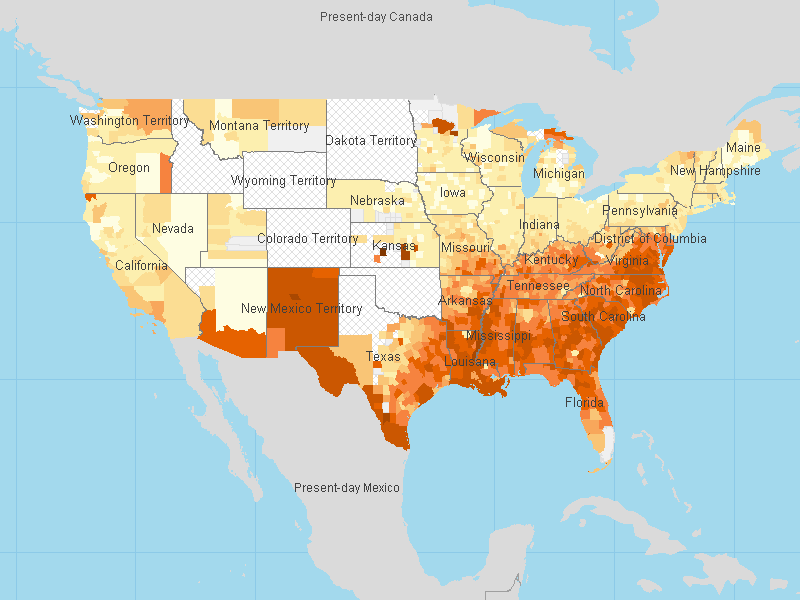
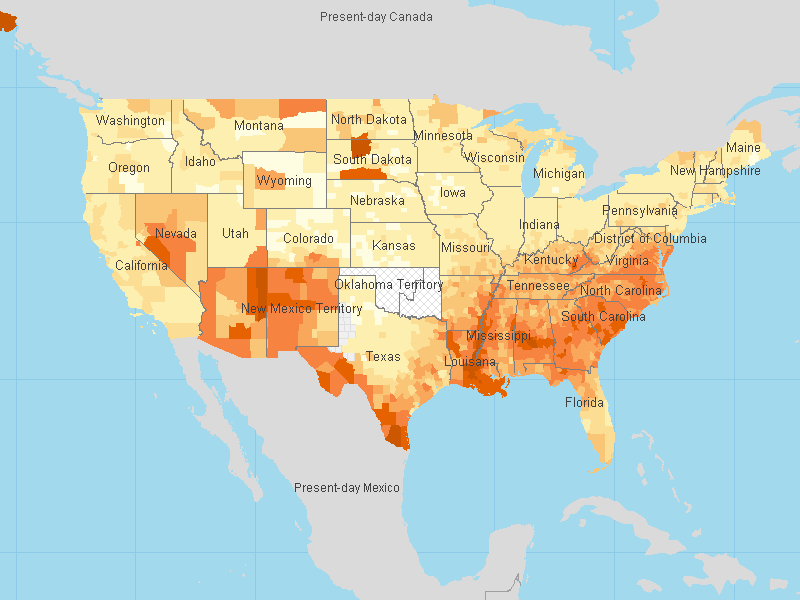
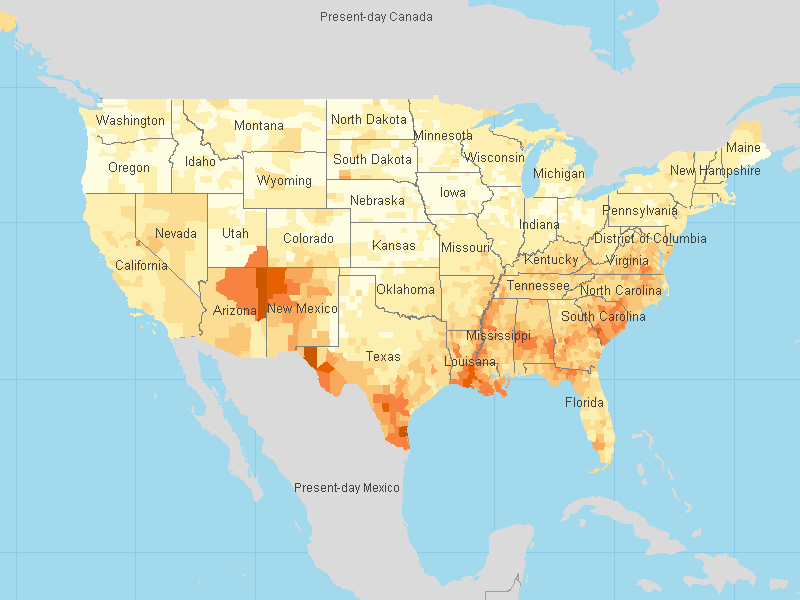
To see the regional trends in literacy rates, you can map the data using Social Explorer. For instance, take a look at these maps of the illiterate population (age 10 and up) from 1870 to 1930 to explore variations around the country and changes over time.
1870 Illiterate Population (age 10 and over)
1900 Illiterate Population (age 10 and over)
1930 Illiterate Population (age 10 and over)
For more information literacy rates for different groups, such as gender, race and foreign born, check out Social Explorer’s reports. The census discontinued tracking literacy data in 1940, and focused more on educational attainment, which we will explore in our next feature.
We hope you enjoyed parts one and two of our back to school series. Check back soon for part three. We promise there won’t be a quiz, but data just might help you succeed in school.
*Early editions of the census used the terms “colored” and “free colored” population to describe African-Americans/blacks. For another example of census terminology, see this post about Native Americans.
This report is also available on the Social Explorer blog.


[…] Read Part two. This report is also available on the Social Explorer blog. […]